What Does the Winter Storm Severity Index Tell You?
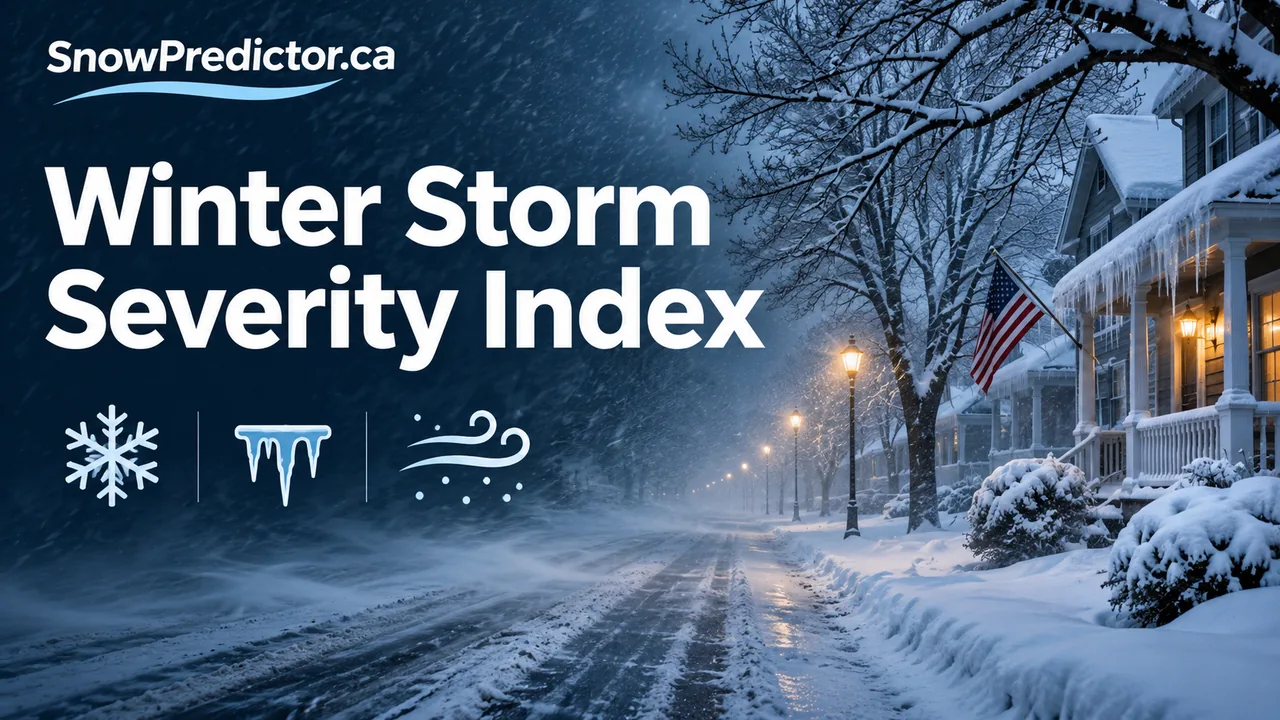
The Winter Storm Severity Index, or WSSI, describes potential winter-weather impacts. A snowfall forecast estimates how much snow could fall. The WSSI adds context about how forecast conditions may affect the area. It can be a good first look at where a storm may cause disruption across a wider region.
Start with the forecast window
Open the NWS Winter Storm Severity Index and look for the product and time period you are viewing. Find your community and any areas you will travel through. A trip can cross areas with different impact categories even when its two endpoints look similar on the map.
Check which component contributes to the overall result where the tool shows that detail. Ice, blowing snow and snow load can create different problems. For instance, an ice-driven result points you towards checking surface conditions and official travel information, while a snow-driven result makes the timing of accumulating snow particularly relevant.
Use three sources for a school morning
Use the impact map for regional context, the local National Weather Service forecast for timing and alerts, and the school district for opening or transport decisions. If the storm arrives during the afternoon, check after-school plans separately. The SnowPredictor U.S. hub links to local forecasting and school guidance.
How to read a route across two impact areas
Imagine your town sits in an area shaded for minor impacts, but the road towards school crosses an area marked for moderate impacts. Check the category legend for each segment, then use the local forecast to find when the higher-impact conditions are expected. A single colour at your home address leaves out the rest of the trip. If a forecast office has issued a watch, warning or advisory, read its timing and instructions directly. The impact map and the alert offer different details for the same decision.
Which layer should you open?
Use the overall layer to spot the areas of greatest concern. Then inspect the individual snow amount, snow load, ice and blowing snow layers to see which hazard deserves a closer look. The overall result reflects the strongest component. Two places with the same overall colour may face different hazards. See NWS WSSI map and legend.
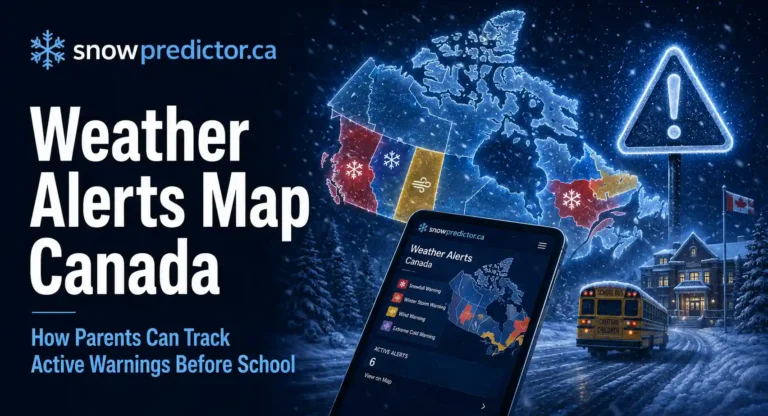
Related reading: Canadian weather alerts guide.