How Accurate Is a Snow Day Calculator in Canada?
A snow day percentage can look precise. The tool shows 72%, parents prepare for a closure and students assume the decision is nearly settled. By morning, however, the school may still be open. That does not automatically prove the calculator is useless, but it does expose a common misunderstanding about probability.
So, how accurate is a snow day calculator? There is no honest universal percentage. Performance depends on forecast quality, location matching, the type of closure being predicted and how the provider measures results. A trustworthy calculator should publish enough evidence for users to evaluate its claims.
This guide explains what accuracy means, which statistics matter, why predictions fail and how to use SnowPredictor responsibly. It provides the evidence needed to answer how accurate is a snow day calculator without relying on marketing claims.
The Short Answer: How Accurate Is a Snow Day Calculator?
A well-designed calculator helps with planning when conditions are clearly mild or disruptive. Its hardest cases involve uncertain snowfall, mixed precipitation, changing timing or different decisions among neighbouring authorities.
An accurate snow day calculator needs more than reliable weather data. It must connect conditions to a defined outcome, then test archived predictions against real decisions without changing the rules afterwards.
No published percentage should be accepted unless the provider explains:
- Which locations and winter seasons were tested
- How many predictions were included
- What counted as a closure or correct result
- When each prediction was recorded
- Whether ordinary open days were included
- How probabilities, not just yes-or-no calls, were scored
- Whether the test data were separate from model-development data
Without those details, a “95% accurate” badge is advertising, not evidence.
Why Snow Day Accuracy Is Hard to Measure
Weather forecasts predict observable conditions such as temperature, snow and wind. A snow day tool predicts a human response to those conditions. This makes snow day prediction accuracy harder to calculate.
Officials may assess roads, receive bus-operator reports and consider staffing or building access. Public calculators may not see this information. Similar weather can produce different decisions because routes and operating environments differ.
There is another basic problem: “snow day” is not one consistent outcome. It can mean:
- Every school building is closed
- Schools remain open but all buses are cancelled
- Only selected transportation zones are cancelled
- One school closes because of power or heating failure
- In-person classes move online
- Opening is delayed or dismissal happens early
If a test combines these outcomes, its accuracy rate becomes difficult to interpret. The target must be defined before any prediction is scored.
What Does a Snow Day Percentage Actually Mean?
A snow day probability communicates uncertainty. If a well-calibrated model issues many 70% predictions for comparable situations, the predicted event should occur approximately seven times out of ten across that group.
It does not mean:
- Your individual school is 70% closed
- Seventy percent of schools will close
- The forecast is 70% accurate
- Closure is guaranteed because the percentage is above 50%
- The number will remain unchanged overnight
A single event cannot prove whether a 70% estimate was statistically good or bad. Closure was considered likely, but a 30% chance of remaining open still existed. Performance emerges across a large set of recorded forecasts.
The snow day percentage explanation covers how families should read low, moderate and high estimates without converting them into promises.
Four Ways to Test Snow Day Calculator Accuracy
When asking how accurate is a snow day calculator, look beyond a percentage-correct score. Meaningful school closure prediction accuracy requires several measurements.
| Measurement | What It Tests | Main Limitation |
|---|---|---|
| Classification accuracy | How often a yes-or-no prediction matched | Depends heavily on the chosen cutoff |
| Precision | How often predicted closures actually closed | Does not measure missed closures |
| Recall | How many actual closures were predicted | Can reward excessive high-risk calls |
| Probability calibration | Whether forecast bands match observed rates | Needs many predictions in each band |
| Brier score | Average squared error of probability forecasts | Less intuitive for general readers |
1. Classification Accuracy
A provider might call every estimate above 50% a predicted closure and every estimate below 50% a predicted opening. The resulting correct predictions are divided by all tested cases.
This measure is easy to inflate. Since most winter days are open, an always-open model could look successful while providing little storm value. Testing only major storms instead excludes difficult borderline events.
2. Precision and Recall
Precision asks: when the model predicted closure, how often did closure occur? Recall asks: of all actual closures, how many did it identify?
Both matter. A calculator that warns about nearly every flurry may capture most closures but create too many false alarms. A conservative model may avoid false alarms but miss disruptive events. Reporting only the better-looking measure hides the trade-off.
3. Probability Calibration
Probability calibration checks whether the percentages behave as advertised. Across a large sample, closures should occur near 20% of the time when the model says 20%, near 60% at 60% and near 90% at 90%.
Calibration is more informative than simply labelling everything above 50% “correct” or “incorrect.” It tests the number users actually see and use for planning.
4. Brier Score
The Brier score measures the squared difference between a predicted probability and the actual binary outcome. A closure is recorded as 1 and an opening as 0. Lower scores are better, with zero representing perfect probabilistic forecasts.
For example, assigning 90% to a closure produces a small error if the school closes and a large error if it stays open. This rewards confident forecasts when justified and penalizes misplaced confidence. The score should still be accompanied by sample size, baseline comparisons and calibration results.
What Factors Affect Snow Day Predictor Accuracy?
Weather Forecast Quality
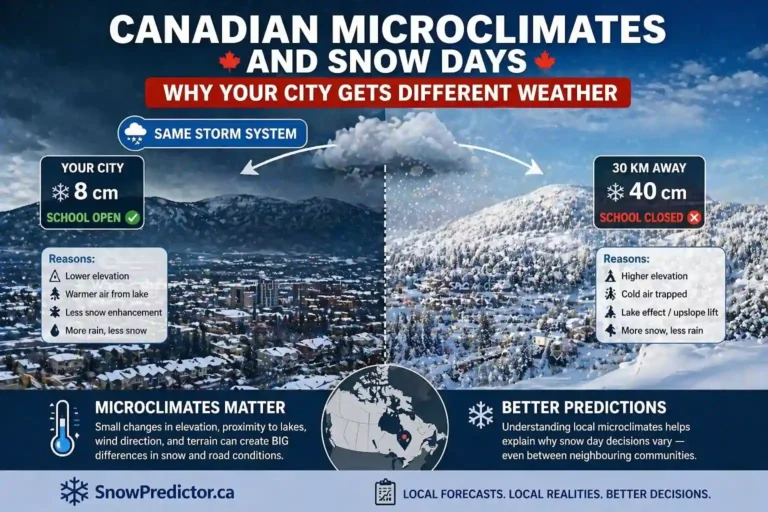
Every calculator depends on its input forecast. Weather forecast uncertainty increases when storm tracks, lake-effect bands, freezing lines or precipitation types are difficult to locate. A small shift can change snowfall or ice conditions across a school boundary.
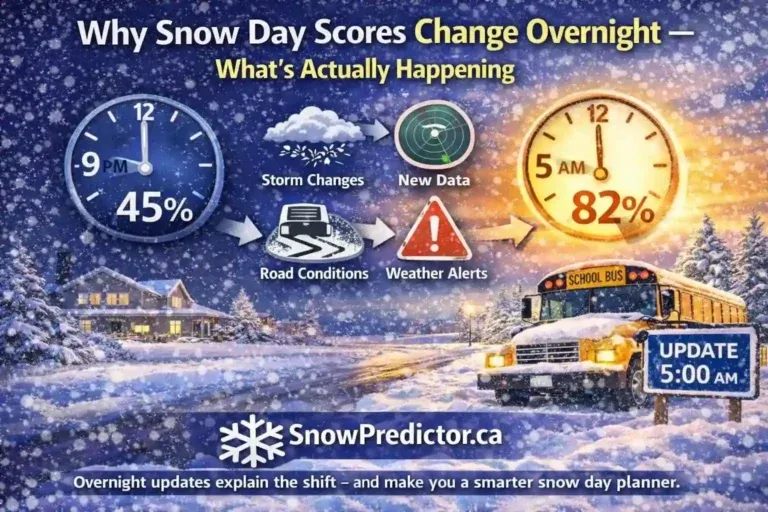
Weather models also evolve as new observations arrive. An evening prediction may reasonably differ from a morning result because the underlying forecast changed. That is why users should review the reasons snow day scores change during active storms.
Storm Timing
The same snow total can create different outcomes depending on when it falls. Snow ending before midnight gives road crews more clearing time than heavy accumulation during morning bus departures. Ice or a flash freeze arriving near the travel window can raise risk despite modest precipitation totals.
Local Geography and Transportation
A Canadian snow day calculator should account for regional differences. Rural routes face drifting and limited visibility across exposed roads. Urban boards may have shorter routes, public transit and different snow-removal resources. Coastal regions, lake-effect corridors and northern communities face distinct hazards.
School Authority Decisions
School closure prediction remains a forecast of human behaviour. Leadership, policy, road inspections, bus-contractor advice and available staff can influence the call. Historical patterns provide context, but they do not bind tomorrow’s decision.
The Selected Outcome
School bus cancellations and building closures must be scored separately. A tool could correctly identify hazardous transportation conditions while the board keeps buildings open. Calling that result entirely wrong or entirely right without defining the target distorts the evaluation.
Why Published Accuracy Claims Can Be Misleading
Some calculator websites publish rates above 90% without a usable dataset or methodology. A large number is not proof. The following practices can make snow day predictor accuracy look stronger than it is:
- Counting every calm winter day as an easy correct prediction
- Testing only severe storms with obvious outcomes
- Removing uncertain predictions from the results
- Combining multiple forecasts from the same event without explanation
- Choosing the best update time after seeing the decision
- Treating bus cancellations as closures when convenient
- Testing on the same examples used to tune the model
- Publishing percentages without event-level records
Providers often showcase impressive calls and explain away misses, but anecdotes cannot establish performance. A defensible study archives every eligible prediction under rules set in advance.
How SnowPredictor Should Report Its Accuracy
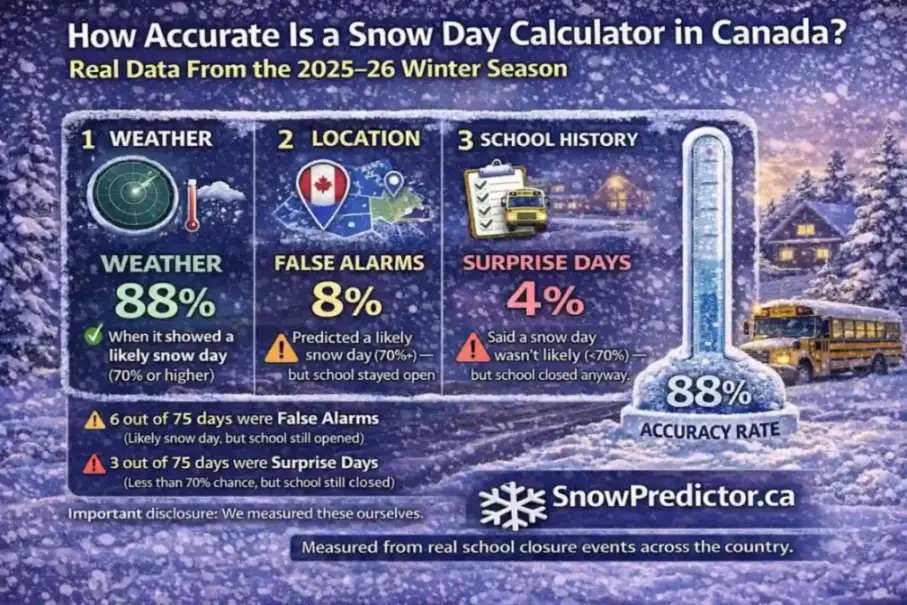
The current public page previously presented specific seasonal and board-level rates. Those figures should not be treated as independently verified unless SnowPredictor publishes the underlying prediction log and closure sources.
A stronger public report for snow day calculator Canada would include:
| Required Disclosure | Why Users Need It |
|---|---|
| Timestamped prediction log | Prevents results from being altered later |
| Board and forecast date | Shows exactly what was tested |
| Defined target outcome | Separates closures from bus cancellations |
| Official decision source | Makes verification possible |
| Inclusion and exclusion rules | Reveals selection bias |
| Probability score and calibration | Tests the displayed percentages |
| Version or model changes | Explains whether results are comparable |
Until that evidence exists, SnowPredictor should position itself as a Canadian planning tool rather than claim a proven national accuracy rate. Transparency is a stronger long-term differentiator than an unsupported “most accurate” statement.
When Is a Snow Day Prediction Most Reliable?
Extreme situations are usually easier to classify than borderline ones. Mixed precipitation, uncertain timing and localized bands create the widest range of outcomes.
Morning predictions can benefit from overnight observations, but they are not automatically more accurate. A provider must compare evening and morning forecasts using the same events and scoring rules before claiming an improvement.
A morning estimate may be better informed but less useful for arranging childcare. An evening estimate offers more planning time but greater uncertainty.
How to Use a Snow Day Calculator Responsibly
The practical answer to how accurate is a snow day calculator depends partly on how it is used. Do not reduce the next storm to one historical rate. Follow this routine:
- Select the correct city, school-board area and forecast date.
- Treat the percentage as planning guidance rather than confirmation.
- Read the local forecast and full Environment Canada alert.
- Check precipitation type, timing, wind and visibility.
- Recheck if the storm forecast changes overnight.
- Confirm the outcome through the responsible school or transportation authority.
SnowPredictor.ca helps families prepare for possible winter school closures. It cannot replace road inspections or issue official school closure announcements. For snow day prediction Canada, that distinction is essential when deciding how accurate is a snow day calculator for real-life planning.
Frequently Asked Questions
How accurate is a snow day calculator?
Accuracy varies with forecast quality, location data, the target outcome and testing method. A credible tool should publish its sample, period, archived forecasts, closure sources and probability scoring. Without those details, no headline percentage can be independently evaluated.
What Does a 70% Snow Day Chance Mean?
If a model is properly calibrated, closures should occur roughly seven times out of ten across many comparable 70% predictions. It does not guarantee that your school will close tomorrow or mean the calculator itself is 70% accurate.
Why Can a Snow Day Calculator Be Wrong?
Storm tracks, snowfall rates, precipitation type and timing can change. Officials may also use road inspections, staffing reports, building conditions and transportation information unavailable to public tools. Human decisions add uncertainty beyond the weather forecast.
Are Morning Predictions More Reliable Than Evening Predictions?
Morning estimates may use more observed information, but they are not automatically better. The provider must publish time-specific testing using identical cases and rules. Morning results also offer families less time to arrange childcare or adjust work.
Can a Snow Day Calculator Confirm That School Is Closed?
No. It provides an estimate for planning. Only the relevant school board, school division or student transportation authority can confirm whether schools are closed, buses are cancelled, selected zones are affected or operations remain normal.