Snow Day Predictor Map Guide: Read Canadian Closure Risk Correctly
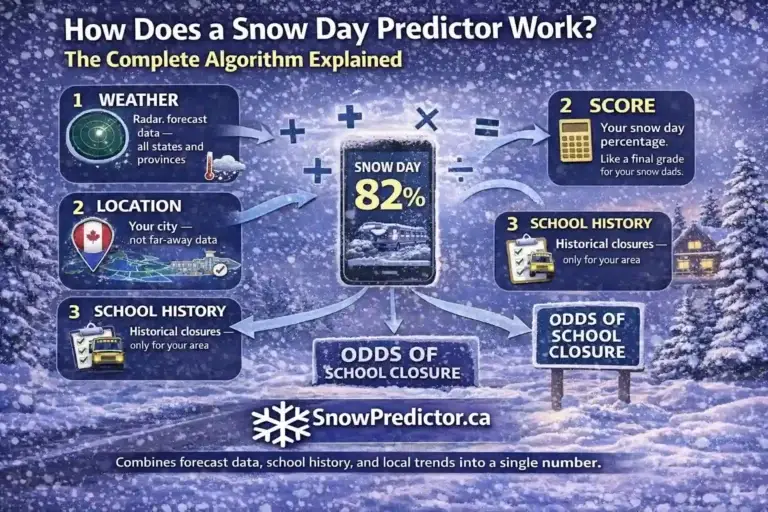
A winter system can make an entire province look threatened while conditions differ sharply from one community to the next. That creates a familiar problem for families: a broad forecast says snow is coming, but it does not show whether a specific school area faces a serious disruption risk. The Snow Day Predictor Map turns location-based estimates into a quick visual overview. Its coloured markers help parents, students and staff identify where closure chances are low, uncertain or elevated.
The map is a planning tool, not an official closure board. This guide explains what every colour means, how to compare nearby locations, why estimates can change and how to check today against tomorrow. You will also learn how weather alerts differ from closure probabilities and where to confirm the final decision before changing your morning plans.
What the Snow Day Predictor Map Shows
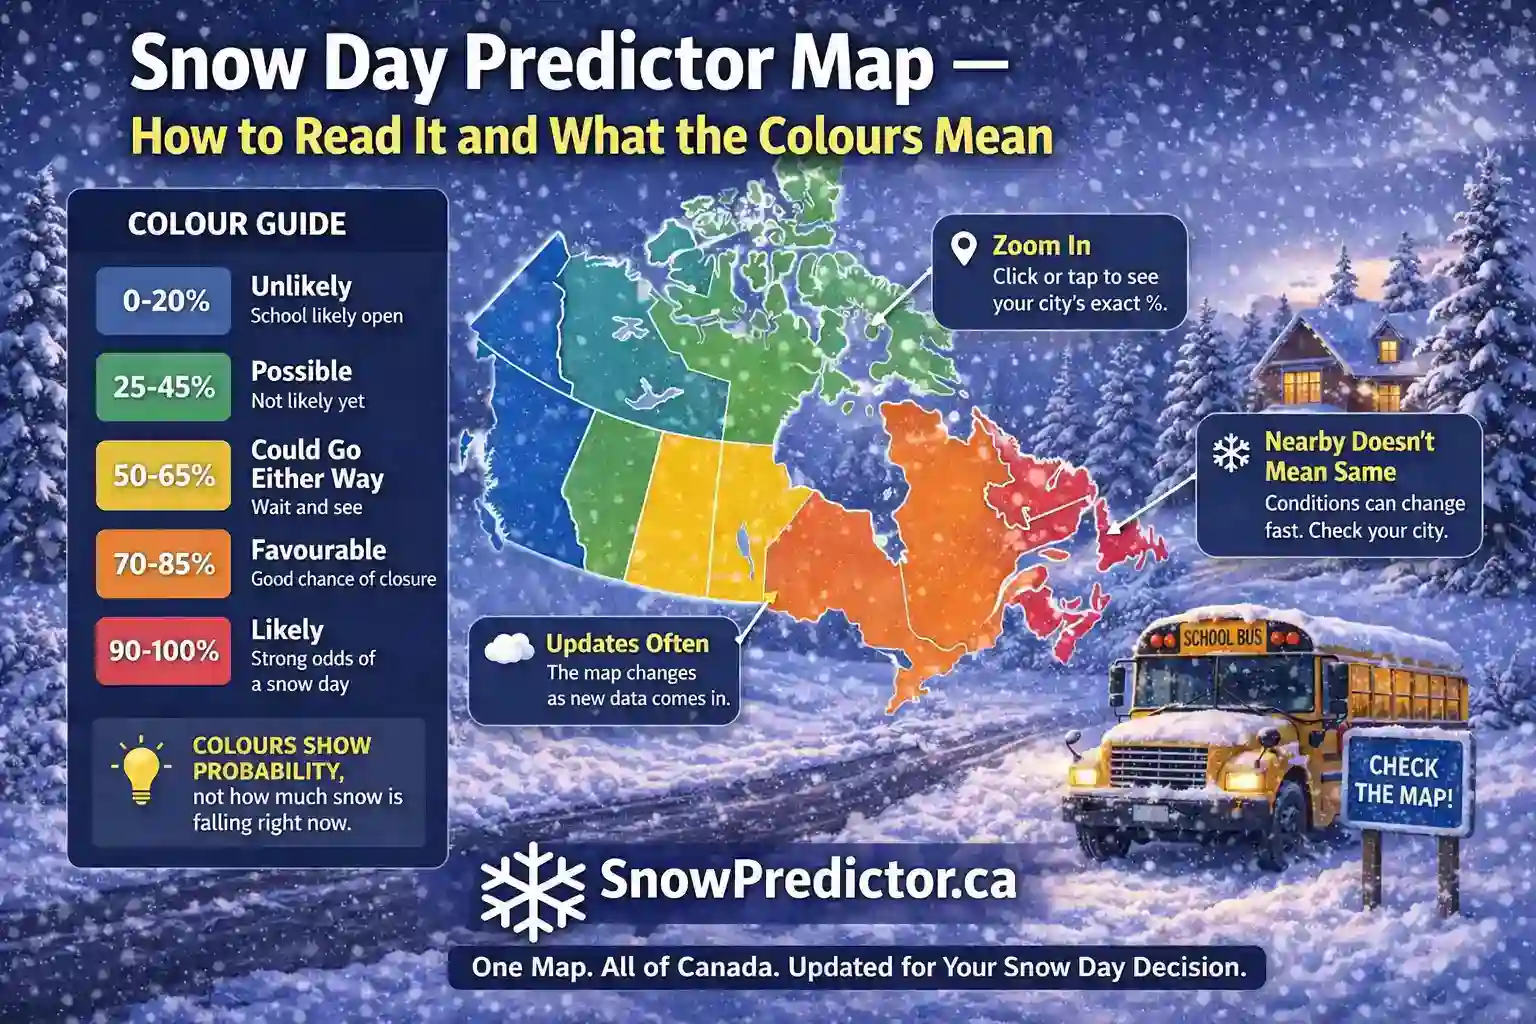
The map displays an estimated school closure probability for supported Canadian cities and school-board locations. Each marker represents a location, while its colour places the current estimate within a probability range. This makes the snow day map Canada view useful for spotting broad storm patterns without opening cities one by one.
The map does not claim that every school inside a coloured area will close or replace a board announcement. It answers: “Where does disruption currently look more likely?” You can then select your location and use the percentage alongside official information.
| Map Element | What It Means | What You Should Do |
|---|---|---|
| City or location marker | A supported prediction location | Select the nearest relevant location |
| Marker colour | The estimate’s probability band | Match it to the legend before planning |
| Percentage | Estimated closure likelihood | Treat it as probability, not confirmation |
| Nearby markers | Regional comparison points | Look for broad or highly localized risk |
| Forecast date | Day represented by the estimate | Confirm you are reading today or tomorrow |
A Canada Snow Day Predictor Map is most useful when you move from the national view to the local one. Your selected location, forecast date and school authority matter more than a dramatic colour hundreds of kilometres away.
Snow Day Map Colours and Probability Bands
The current snow day map legend groups estimates into four bands. A colour makes a large map easier to scan, but the underlying percentage gives the more precise reading.
| Colour | Probability Range | Practical Interpretation |
|---|---|---|
| Green | 0% to 25% | Closure currently appears unlikely |
| Blue | 26% to 50% | Conditions are uncertain or marginal |
| Orange | 51% to 75% | Closure risk is elevated; prepare a backup plan |
| Red | 76% to 98% | Closure appears very likely, but remains unconfirmed |
The snow day map colours describe predicted school disruption, not weather severity. A 55% estimate does not mean 55% of schools will close or the forecast is 55% accurate. It represents the estimated chance of the relevant closure outcome for that location.
Do not confuse these colours with Canada’s official weather-alert colours. Environment and Climate Change Canada uses yellow, orange and red to communicate increasing weather-impact risk. Its map may also use transparency and boundary styles to distinguish watches, warnings and advisories. Those official alerts describe weather hazards; SnowPredictor colours describe estimated closure likelihood. Always read the full alert because the two systems answer different questions.
How to Use the Snow Day Predictor Map Step by Step
Follow the same short process each time to avoid reading the wrong date or assuming the closest marker belongs to your board.
1. Start With Your Location
Open Snow Predictor and find the supported location that best matches your school area. Do not automatically choose the largest nearby city. Rural routes, lake-effect corridors and higher elevations can differ from a nearby urban centre.
2. Confirm the Forecast Day
Check whether the display represents the current day or the next school day. A snow day map today may reflect an event already underway, while a snow day map tomorrow depends more heavily on forecast timing and track. If the dates feel confusing, use the today versus tomorrow guide before interpreting the number.
3. Read Both Colour and Percentage
Use the colour for a quick category, then open the exact estimate. Two orange locations can sit at 52% and 74%, which are different planning signals even though their markers look alike. The snow day probability map simplifies the first scan; location detail guides the next step.
4. Compare Nearby Locations
Look at surrounding markers. If an entire region changes together, a widespread system may be responsible. If one location is orange or red while neighbours remain green, localized snow, freezing rain, elevation, shoreline exposure or a different school authority may explain the contrast.
5. Recheck When Conditions Change
A storm can shift, precipitation can change type and wind can increase. If the estimate moves, consult why snow day scores change rather than treating an earlier number as a promise.
6. Verify the Official Decision
Before changing plans, check your school board, division or transportation consortium. Official websites, notification systems and verified social accounts provide the decision. The predictor helps you prepare; it does not issue the notice.
Why Nearby Cities Can Display Different Colours
A useful school closure probability map preserves local differences. Canadian winter weather can change over short distances.
Narrow Snow Bands and Storm Tracks
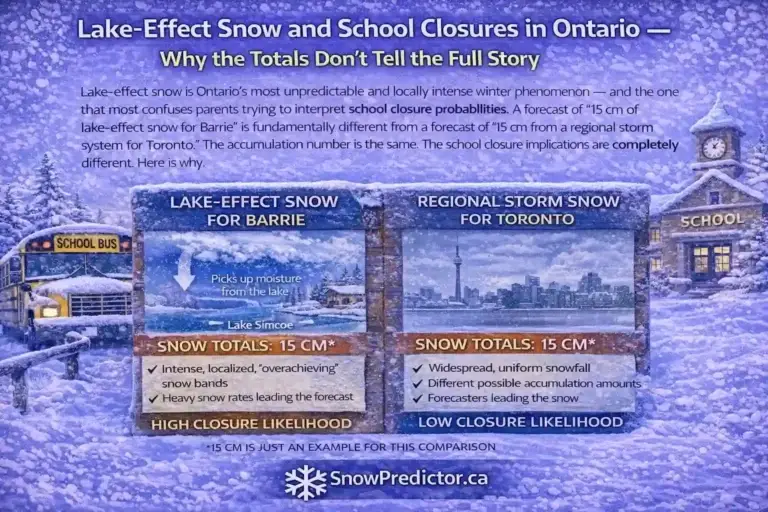
Lake-effect bands can produce heavy snow in one corridor while a nearby city receives much less. Around Georgian Bay, for example, Barrie or Collingwood may face intense snow while parts of the Greater Toronto Area remain outside the band. A storm’s track can similarly place one side of a region in snow and the other in rain or mixed precipitation.
Freezing Rain, Wind and Visibility
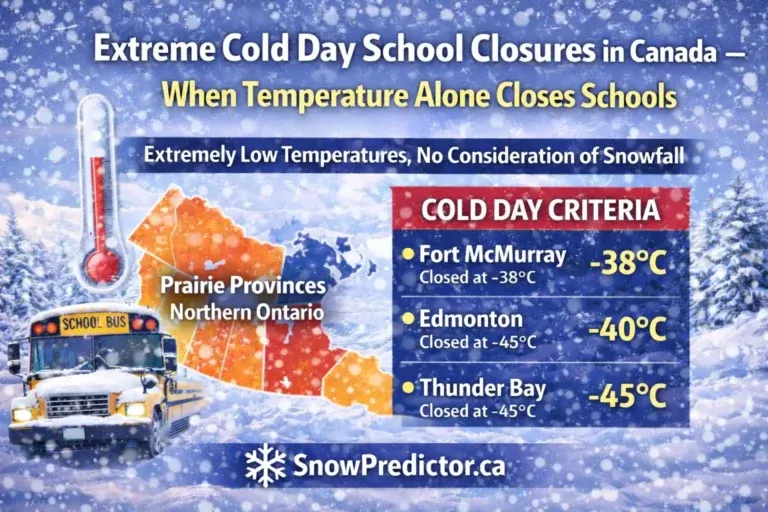
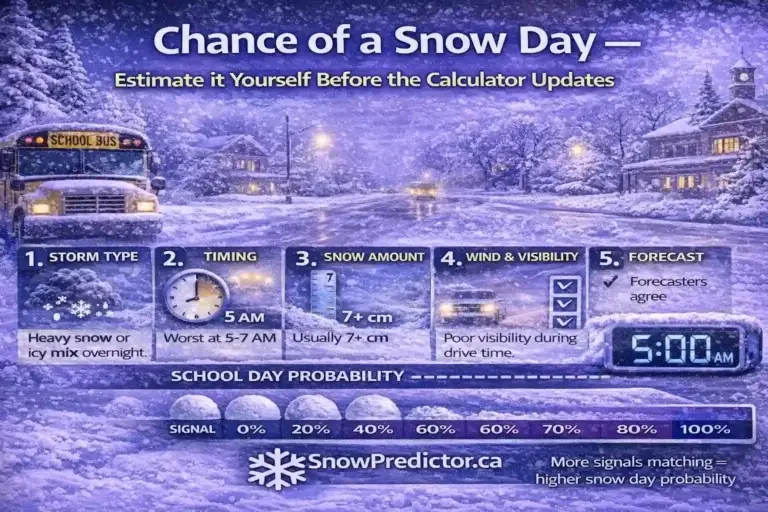
Accumulation is not the only concern. A smaller amount of freezing rain may create more transportation risk than a manageable snowfall. Blowing snow can reduce rural visibility after precipitation has weakened. Temperatures near freezing can also turn wet roads icy before buses begin their routes.
School Authority and Route Differences
Two adjacent communities may belong to different boards or transportation systems. Their road networks, rural route exposure, maintenance capacity and operating decisions can differ. That is why an Ontario snow day map should never be read as one province-wide verdict. Even within the snow day map Ontario view, the relevant authority remains local.
Map View Versus a Location-Level Prediction
The snow day forecast map gives regional context; a detailed location page identifies what to monitor.
| Question | Best View to Use |
|---|---|
| Is risk widespread across my region? | National or provincial map |
| What is the estimate for my city? | Location-level percentage |
| Why does my city differ from neighbours? | Map plus local forecast details |
| Has the forecast changed since last night? | Updated location result |
| Is my school officially closed? | Board or transportation authority notice |
For snow day prediction Canada searches, a national map offers breadth, but decisions happen locally. Understand the pattern, then focus on the organization responsible for your school.
What the Map Cannot Tell You
No school closure map Canada tool can know an unannounced board decision with certainty. Weather data may suggest elevated risk, but officials can consider road inspections, contractor reports, staffing, building access and local policy information that is not fully visible to a public predictor.
The map also has practical limits:
- A marker represents a location, not every road or school catchment around it.
- Board and transportation boundaries may not match city boundaries.
- Narrow precipitation bands can move between forecast updates.
- Conditions on rural and exposed routes may differ from downtown streets.
- A weather forecast can change in timing, amount or precipitation type.
- A coloured marker does not identify which buses, zones or buildings are affected.
These limits show why a probability should support preparation. A higher estimate can prompt flexible childcare or closer monitoring, but it is not a guaranteed result.
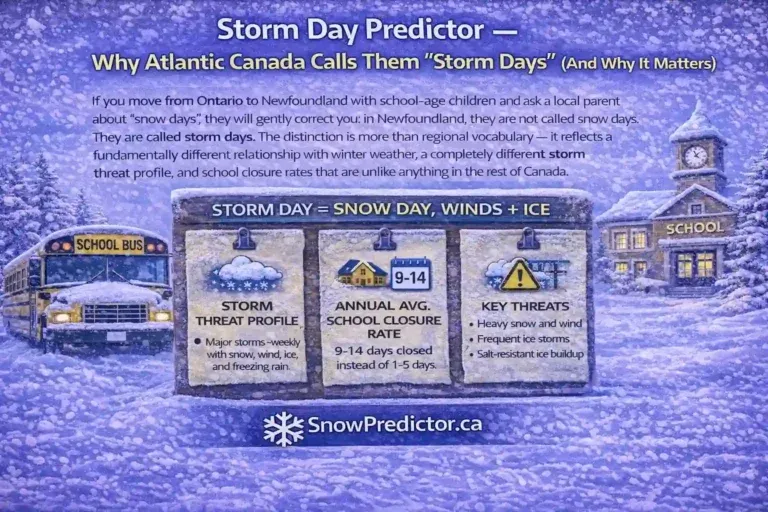
Bus Cancellation Is Not Always a School Closure
A school bus cancellation map may report transportation status, while SnowPredictor estimates broader closure probability. Those are not interchangeable outcomes. In many Canadian districts, buses can be cancelled because routes are unsafe even though school buildings stay open for students who can arrive safely by another method.
Read every official notice carefully. Look for wording such as “transportation cancelled,” “schools closed,” “schools open,” “specific zones affected” or “all facilities closed.” Ontario families can review the difference between a cancelled bus and a closed school before the next storm morning.
This distinction also explains why a predictor result may appear inconsistent with a transportation announcement. The tool and authority may be describing different outcomes. For Canadian school closures, the board’s own notice remains the final source.
How to Compare the Map With Official Weather Alerts
Use the predictor and the official weather alerts Canada map as complementary tools. Environment Canada provides forecasts, watches, advisories and warnings for weather hazards. SnowPredictor translates relevant conditions into an estimated school-disruption signal.
A sensible check looks like this:
- Read the local forecast and full official alert text.
- Note timing, precipitation type, wind, visibility and temperature changes.
- View your location’s probability and surrounding markers.
- Recheck near the school authority’s normal announcement window.
- Confirm the final status through the responsible organization.
An alert does not automatically produce a snow day, and the absence of a high-level alert does not guarantee normal transportation. Impact depends on when conditions arrive, how long they last and whether routes can operate safely.
Common Map-Reading Mistakes
Users asking how to use the Snow Day Predictor Map often make one of five avoidable mistakes:
- Reading tomorrow’s colour as today’s status
- Choosing a nearby city served by another school authority
- Treating orange or red as an official closure notice
- Assuming every place within a region receives identical weather
- Comparing a school-closure estimate with a bus-only decision
The solution is simple: confirm the place, date, outcome and source. For example, “Barrie, tomorrow, estimated school closure probability” is a complete interpretation. “Ontario is red, so school is cancelled” is not.
A Better Night-Before and Morning Routine
Use the Snow Day Predictor Map first in the evening to understand the regional setup. If your location is blue or higher, prepare a flexible morning plan and check what time your board normally communicates. The Canadian closure announcement guide can help you identify the likely window.
Check again in the morning because overnight observations may change the estimate. Then go directly to the official board or transportation source. This routine gives you early planning value without mistaking a forecast for a decision.
Frequently Asked Questions
What Does the Snow Day Predictor Map Show?
It shows estimated school closure probability by supported Canadian location. Marker colours group estimates into probability bands, helping users scan regional patterns before opening a specific city or board location for more detail.
What Do the Colours on the Snow Day Map Mean?
Green represents 0% to 25%, blue 26% to 50%, orange 51% to 75%, and red 76% to 98%. These are estimated closure-probability bands. They are separate from Environment Canada’s official weather-alert colours and should not be treated as closure confirmation.
Why Can Nearby Cities Have Different Snow Day Probabilities?
Nearby cities can receive different snowfall, ice, wind and visibility conditions, especially during narrow lake-effect events. They may also use different boards, bus routes and operating practices. Geography and local decision-making can therefore produce contrasting estimates.
Does a High Map Percentage Confirm That School Is Closed?
No. Even a high estimate is planning guidance, not an official decision. Check the website, notification service or verified account of your school board, school division or student transportation authority before acting on a closure.
Is a Bus Cancellation the Same as a School Closure on the Map?
No. A transportation authority may cancel buses while school buildings remain open. Read the official notice to determine whether it applies to transportation, selected zones, individual schools or every building in the board.