Why Snow Day Scores Change Overnight: A Guide for Canadian Families
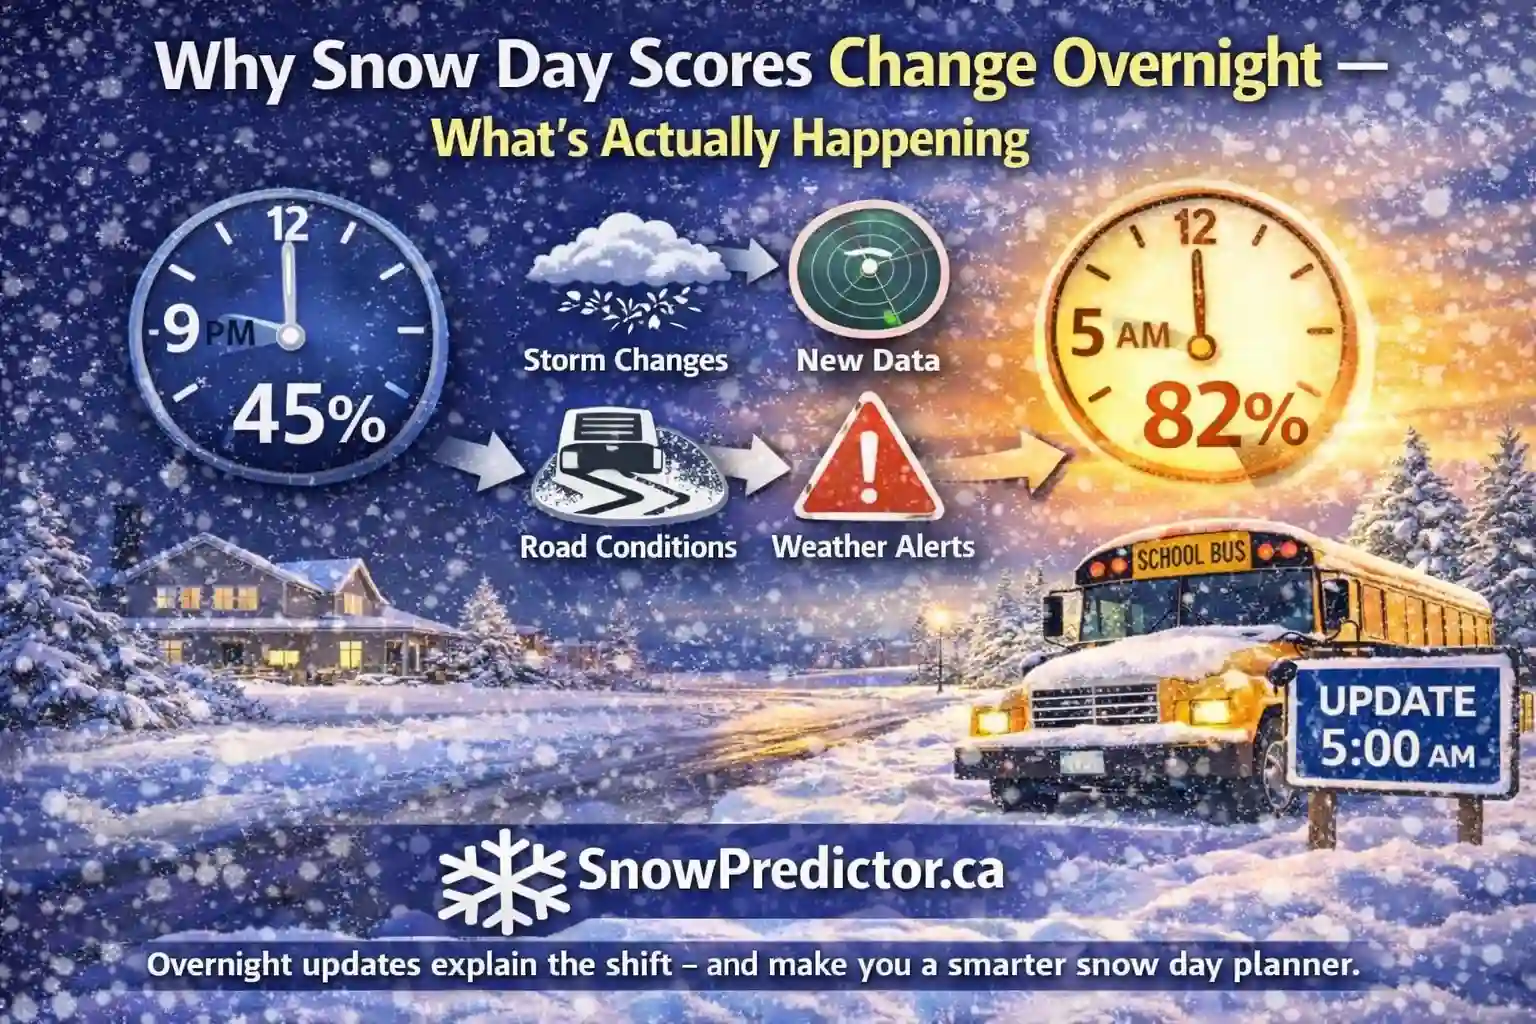
At 9 p.m., the snow day predictor shows 38%. At 5 a.m., it shows 71%. The change can look like a mistake, especially when the weather outside appears unchanged. In reality, the later score may be responding to a different storm track, colder temperature, freezing rain risk or observed road condition that was unavailable the night before.
Understanding why snow day scores change prevents families from treating the first result as permanent or every revision as an error. A probability should respond to meaningful evidence. This guide explains score movement, larger jumps and how to use updates without mistaking them for official announcements.
Snow Day Score Changes at a Glance
| Updated Signal | Why the Score May Rise | Why the Score May Fall |
|---|---|---|
| Snowfall total | More accumulation expected during bus hours | Storm weakens or shifts away |
| Snowfall rate | Roads may be covered faster than crews clear them | Snow becomes lighter or intermittent |
| Precipitation type | Freezing rain or flash-freeze risk increases | Ice changes to rain or manageable snow |
| Storm timing | Hazard moves into the morning commute | Storm arrives after transportation finishes |
| Wind and visibility | Drifting or whiteout risk develops | Gusts weaken or snow ends |
| Temperature | Colder surfaces increase icing risk | Temperatures stay above freezing |
| Road observations | Routes are deteriorating or closing | Plowing and treatment improve travel |
| Local operations | Transportation concern becomes broader | Official checks find routes manageable |
A score may move because one serious input changes or because several smaller changes point in the same direction.
Why Snow Day Scores Change: First Define the Outcome
A score estimates a defined weather-related outcome, such as a building closure, complete bus cancellation, selected route cancellation or any disruption.
This distinction matters when investigating why a snow day score changed. A transportation prediction cannot be judged as a building-closure prediction.
The result is time-specific. Tomorrow’s score is not today’s status, and a city estimate may not match a route notice. Every snow day percentage update should identify:
- Location and school region
- Forecast date
- Time of the latest update
- Predicted event
- Main weather hazards
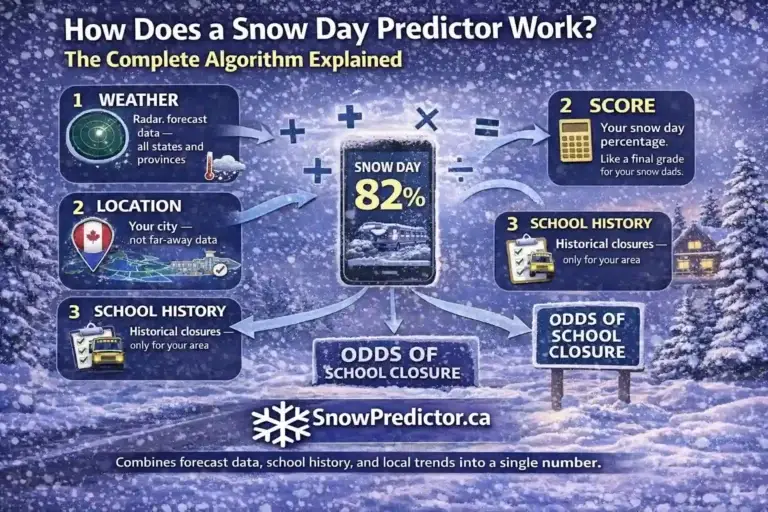
The snow day percentage guide explains how to interpret the number itself. This page focuses only on why that number moves.
Eight Reasons Why Snow Day Scores Change
1. New Forecast Data Becomes Available
Weather systems ingest new observations and produce updated guidance about temperature, moisture, wind and storm position.
Overnight weather model updates can alter one town’s outlook even when the regional forecast looks similar. A predictor should recalculate from meaningful new data.
Not every refresh means a new model run. A website may refresh more often than its source updates, so it should display the data time.
2. The Storm Track Shifts
A small track shift can move heavy snow or freezing rain into another corridor. Communities near the precipitation edge are sensitive.
If the snowfall forecast changed from a direct hit to a near miss, the score may drop sharply. If the storm moves closer or strengthens, the score can rise. Lake-effect snowbands and coastal systems may create particularly large local differences.
The location has moved into or out of the system’s most hazardous area.
3. The Storm Timing Changes
Ten centimetres does not create equal risk at every hour. Overnight snow during bus service can be more disruptive than the same total starting later.
If the storm timing changed from noon to 4 a.m., the score may rise without an accumulation change. A late-morning delay can lower it.
Afternoon conditions still matter. Officials consider whether buses can return students safely, so a storm expected to intensify before dismissal may keep closure risk elevated.
4. Precipitation Type Changes
Winter storms develop near boundaries among rain, freezing rain, ice pellets and snow. Small temperature differences can change surface precipitation.
A freezing rain forecast change can raise concern because glaze reduces traction. A change to rain may lower risk when surfaces stay above freezing.
There is no defensible universal rule saying every snow-to-ice change must add a fixed number of points. The effect depends on expected ice, timing, road temperature, treatment and route exposure. The freezing rain versus snow guide explains that comparison.
5. Snowfall Rate Changes
The total can stay constant while its rate changes. Twelve centimetres over twelve hours differs from the same amount falling rapidly near sunrise.
A higher rate can recover treated roads and reduce visibility, while a lower rate gives crews more time.
6. Wind and Visibility Forecasts Change
Strong wind can drift snow over cleared roads and hide lane markings or vehicles. Open rural routes are especially exposed.
If gusts strengthen while snow is available to move, the estimated disruption risk may increase. If the wind weakens or the snow becomes wet and less mobile, the score may decrease.
7. Temperature Crosses a Critical Boundary
A small temperature difference can change rain to freezing rain, wet roads to ice or powder to wet snow. Forecasts near 0°C are sensitive.
A rapid temperature drop after rain or melting snow creates flash-freeze risk. Conversely, temperatures staying above freezing may prevent forecast ice from forming on many surfaces. The flash freeze school closure guide explains why surface water and cooling rate matter together.
8. Observations Replace Forecast Assumptions
Before a storm, a predictor relies on forecasts. Overnight radar, stations and road reports show actual conditions.
Snow may accumulate faster than expected, freezing rain may fail to develop or a narrow band may settle over a different area. Road crews may report improving highways while rural routes remain poor. New observations can therefore move a score in either direction.
Why Snow Day Scores Change in Large Jumps
Large shifts occur when an input crosses a model boundary or several related inputs change together.
For example, a newer forecast might simultaneously move snow into the morning commute, increase the snowfall rate and strengthen wind. The combined effect can be much larger than the change in total accumulation alone.
Mixed precipitation creates weather forecast uncertainty because surface temperature, warmer air aloft and timing interact. Forecast model disagreement may persist until observations clarify the scenario.
A large jump is not automatically correct. The tool should use stable rules, current data and a clear event definition. Unexplained volatility caused by a technical error, stale cache or location mismatch is a product problem rather than genuine weather uncertainty.
Why Snow Day Scores Change Downward During Snow
A lower result does not necessarily mean the storm disappeared. The operational timing may have improved.
The score may fall because:
- Most snow has already ended
- Roads have been plowed and treated
- The heaviest band shifted away
- Temperatures rose and reduced ice risk
- Winds weakened and visibility improved
- The remaining snow arrives after transportation
- The official area is smaller than first forecast
This explains why the question “why snow day scores change” cannot be answered by snowfall totals alone. School disruption depends on impact, not just weather intensity.
Why Snow Day Scores Change Upward as Snowfall Falls
The reverse can also happen. Forecast snow may decrease from 15 centimetres to 9 centimetres while the closure estimate increases.
That can be reasonable if the newer forecast introduces freezing rain, places the heaviest period at 6 a.m., predicts stronger wind or shows a flash freeze. A lower total concentrated into a shorter period may also create worse roads during bus service.
Look at the complete input change before deciding that the snow day probability changed in the wrong direction.
Do Snow Day Prediction Changes Overnight Mean Poor Accuracy?
Not by itself. A system should update when evidence changes. Refusing to revise an old estimate may make it look stable but less informed.
Snow day prediction accuracy must be evaluated across many dated forecasts. A fair review should compare the latest eligible pre-decision prediction with the exact outcome the tool claimed to estimate. It should include successful and failed cases rather than selected screenshots.
Useful evaluation questions include:
- Were the location and date correct?
- Was the prediction made before the official decision?
- Did it predict buses or building closure?
- Was the displayed percentage properly calibrated?
- Were technical errors separated from forecast misses?
The fact that a snow day score changed shows revision, not accuracy or inaccuracy.
How Families Should Respond to Score Changes
Use the score for planning. Do not refresh repeatedly when inputs have not updated.
When the Score Rises
Check which hazard became more serious. Activate backup childcare or work arrangements when the increased risk would materially affect the household. Then wait for the official notice.
When the Score Falls
Do not assume every road is safe. Confirm whether the forecast timing improved and review current road information. Continue monitoring if freezing rain, squalls or rapidly changing conditions remain possible.
When the Score Keeps Reversing
Look for near-freezing temperatures, mixed precipitation, narrow snowbands or disagreement among forecasts. These setups contain real uncertainty. Treat the range of recent results as a sign to keep plans flexible.
How SnowPredictor Updates Should Be Used
SnowPredictor Canada provides an early snow day prediction Canada estimate for family planning. Check that the location, forecast day and last-updated time are correct before comparing two scores.
If the school closure probability changed, compare snowfall, ice, wind, temperature, visibility and timing. A useful snow day forecast update should trace to new information.
The tool remains separate from the school authority. A school closure forecast cannot officially cancel transportation or close a building.
Confirm the Final Outcome Through Official Channels
A prediction may update until the local authority makes its decision. Families should check the school board or division and the responsible transportation provider for the final operating status.
Read whether the announcement covers one route, a weather zone, all buses or school buildings. The guide to bus cancelled versus school closed explains these different outcomes. For usual reporting windows, see when Canadian schools announce closures.
Frequently Asked Questions
Why Did My Snow Day Score Change Overnight?
Updated forecasts may have changed snowfall, precipitation type, storm timing, wind, temperature or visibility. Overnight observations and road reports can also replace earlier assumptions with evidence of what is actually happening.
Why Did the Score Increase When the Snow Total Decreased?
Ice risk, stronger wind, worse visibility or more disruptive timing may have increased. A lower snow total can still create greater transportation risk if it falls rapidly during bus service or combines with another hazard.
Why Did the Score Drop While It Was Still Snowing?
The heaviest snow may have ended, routes may be improving or the remaining accumulation may fall outside transportation hours. The score estimates school disruption rather than whether snowflakes are currently falling.
Do Snow Day Calculator Changes Mean the Tool Is Broken?
No. Snow day calculator changes are reasonable when new inputs arrive. Repeated unexplained movement without weather changes, an incorrect location or stale update times may indicate a technical issue worth reporting.
Which Snow Day Score Should I Trust?
Use the latest correctly dated and located score for planning. Review what changed behind it and then verify the final operating decision through the official school or transportation channel.